
China’s annual import and export statistics, China, the world’s second‑largest economy and its leading goods trader, reached a record high in foreign trade in 2024, further cementing its role as a central hub in global commerce. According to the General Administration of Customs (GAC), the nation’s total goods imports and exports hit 43.85 trillion yuan (about US $6.1 trillion), marking a 5% year‑on‑year increase.
Export Performance
- Total exports: 25.45 trillion yuan, up 7.1% from 2023.
- Key growth sectors:
- Machinery and electrical products — up 8.7%, accounting for 59.4% of total exports.
- High‑tech goods such as electric vehicles, 3D printers, and industrial robots saw rapid expansion.
- New trade formats: Cross‑border e‑commerce exports surged, contributing to a total e‑commerce trade value of 2.63 trillion yuan, up by 1 trillion yuan compared to 2020.
Import Trends
- Total imports: 18.39 trillion yuan, up 2.3% year‑on‑year.
- Growth was driven by demand for energy resources, agricultural products, and high‑end manufacturing inputs.
- Imports of advanced technology and components supported China’s industrial upgrading.
Global Standing
- In the first three quarters of 2024, China’s exports and imports accounted for 14.5% and 10.5% of global totals respectively, both slightly higher than in 2023.
- The country maintained its position as the world’s largest goods trader, outpacing other major economies in trade growth.
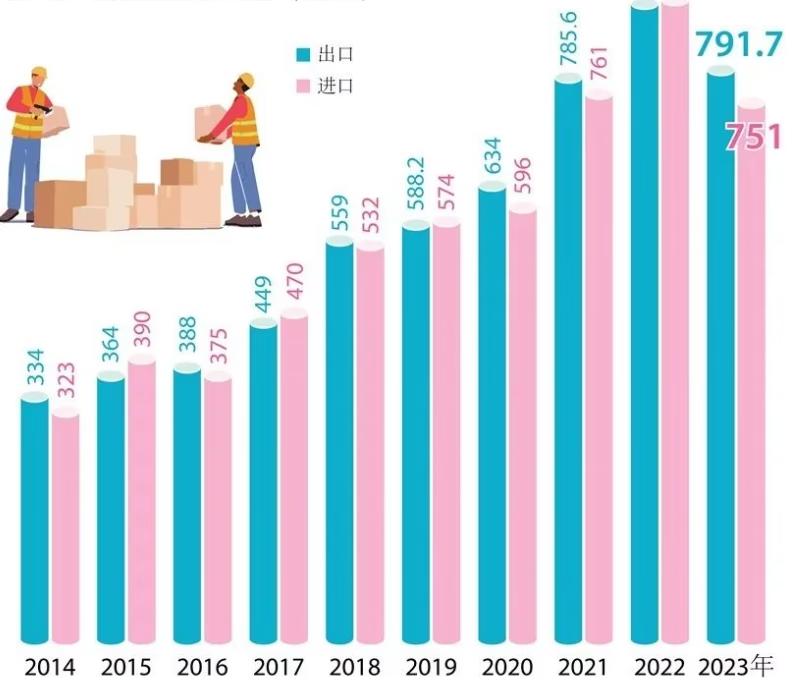
Policy Support and Trade Facilitation
China’s trade performance was bolstered by:
- 16 measures to optimize port business environments and streamline customs clearance.
- Special initiatives in 20 cities to promote cross‑border trade facilitation.
- Policies encouraging diversification of export markets and upgrading of product structures.
| China’s annual import and export statistics(2011-2024) | ||||||
|---|---|---|---|---|---|---|
| Date | Imports and exports (US$ billion) | Exports (US$ billion) | Imports (billion US dollars) | |||
| Amount | Year-on-year(%) | Amount | Year-on-year(%) | Amount | Year-on-year(%) | |
| 2024年 | 61622.89 | 3.8 | 35772.22 | 5.9 | 25850.67 | 1.1 |
| 2023年 | 59359.85 | -5 | 33790.44 | -4.7 | 25569.41 | -5.5 |
| 2022年 | 63065.1 | 4.3 | 35921.4 | 7 | 27143.6 | 1 |
| 2021年 | 60438.7 | 29.8 | 33571.4 | 29.6 | 26867.3 | 30 |
| 2020年 | 46559.13 | 1.7 | 25899.52 | 3.6 | 20659.62 | -0.6 |
| 2019年 | 45778.91 | -1 | 24994.82 | 0.5 | 20784.09 | -2.7 |
| 2018年 | 46224.44 | 12.5 | 24866.96 | 9.9 | 21357.48 | 15.8 |
| 2017年 | 41071.38 | 11.4 | 22633.45 | 7.9 | 18437.93 | 16.1 |
| 2016年 | 36855.57 | -6.8 | 20976.31 | -7.7 | 15879.26 | -5.5 |
| 2015年 | 39530.33 | -8 | 22734.68 | -2.9 | 16795.64 | -14.1 |
| 2014年 | 43015.27 | 3.4 | 23422.93 | 6 | 19592.35 | 0.4 |
| 2013年 | 41589.93 | 7.5 | 22090.04 | 7.8 | 19499.89 | 7.2 |
| 2012年 | 38671.19 | 6.2 | 20487.14 | 7.9 | 18184.05 | 4.3 |
| 2011年 | 36418.64 | 22.5 | 18983.81 | 20.3 | 17434.84 | 24.9 |

How to Choose a Freight Forwarder in China: A Strategic Guide for Global Shippers
Selecting the right freight forwarder is one of the most critical decisions for importers and…

de minimis elimination 2026 china imports fba
For years, cross-border e-commerce ran on a simple, powerful premise: shipments valued at $800 or…

Tariff Engineering: How to Legally Cut Your US Import Duty Bill in 2026
By now in this series, you understand the compliance chain: Amazon FBA forces DDP terms,…